Camilo Belmonte
Hola! Soc dissenyador gràfic especialitzat en disseny editorial i infografia. Treballo com a freelance desde Mataró, una ciutat costera a prop de Barcelona.
EM POTS CONTACTAR A: HOLA@CAMILOBELMONTE.COM
Diseña tu Tiempo
Editorial
Escola Montessori Lleida
Paradigm
presentacions
Educultura
Mites i Llegendes
Iberpay
editorial
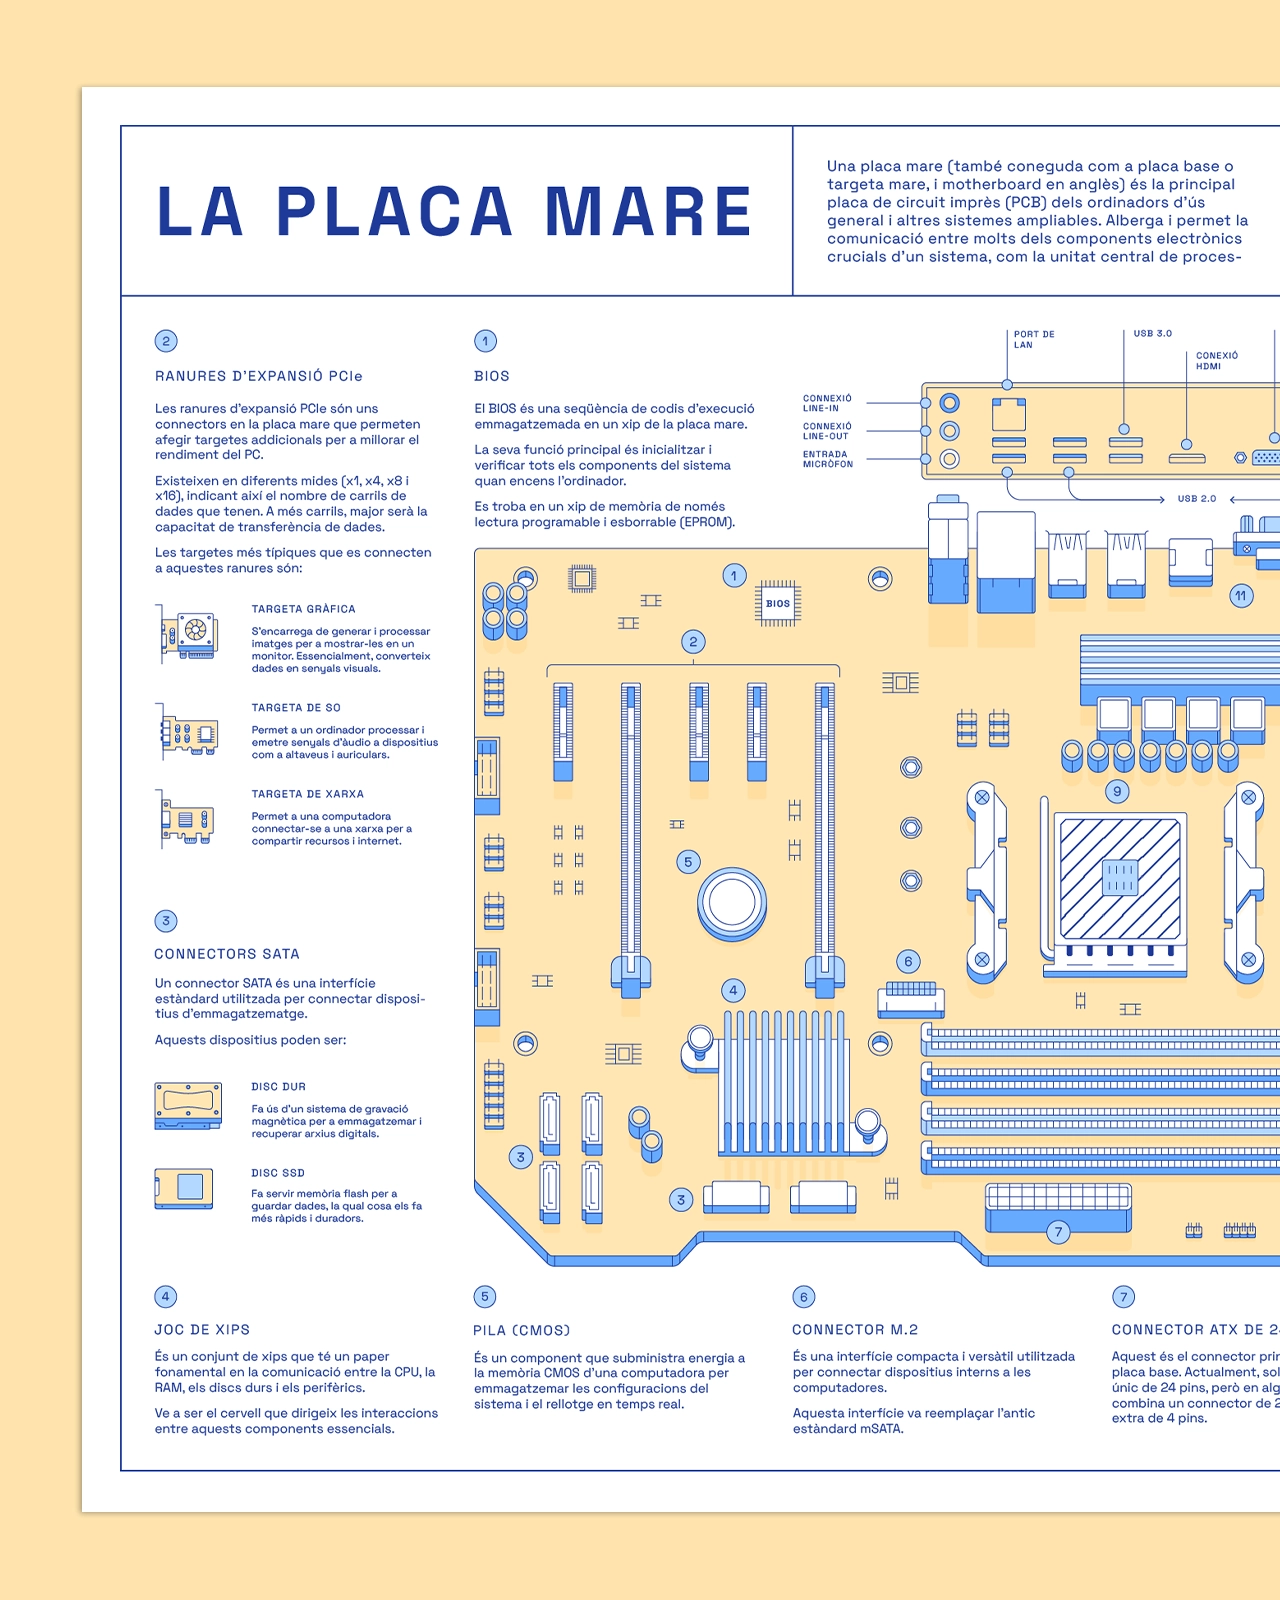
La Placa Mare
infografia
Disseny de Tríptics
Agatha Christie. Queen of Mystery
E-Bike Revolution
Epic Bookstore
Marketing PPT
Disseny editorial i infografia
657 67 32 38
Instagram
Behance
All rights reserved 2025
Legal